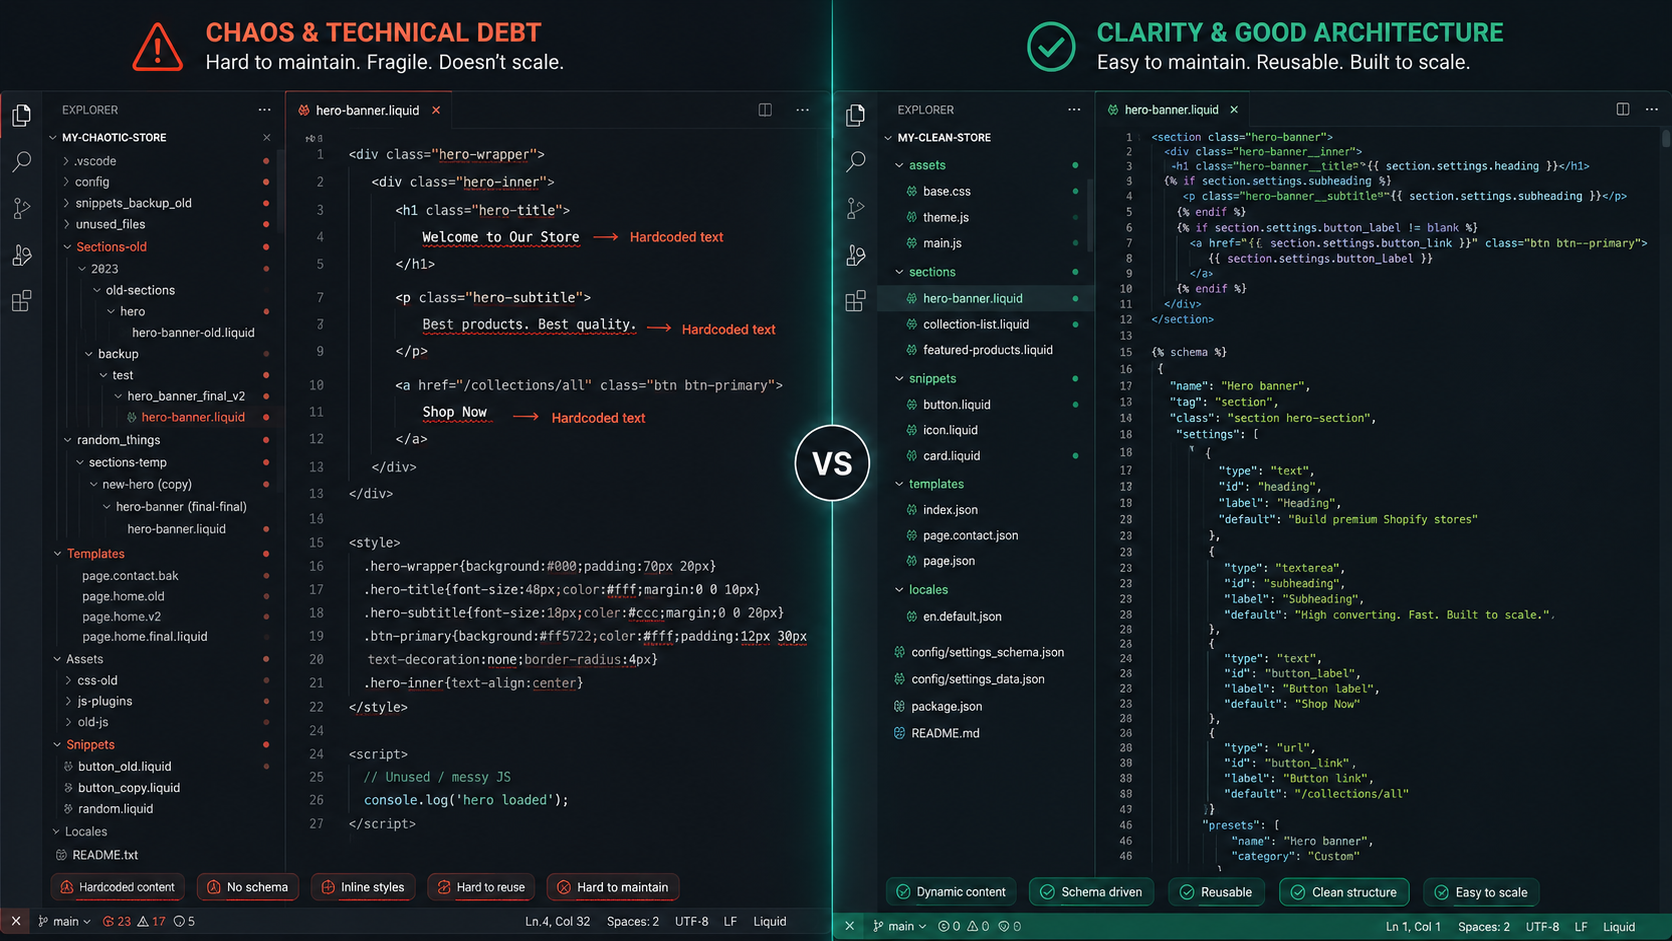
Part 2 of an 8-part series on building production-grade Shopify themes In the first post of this series, we covered the mistakes that quietly turn a custom Shopify theme…
Quick answer
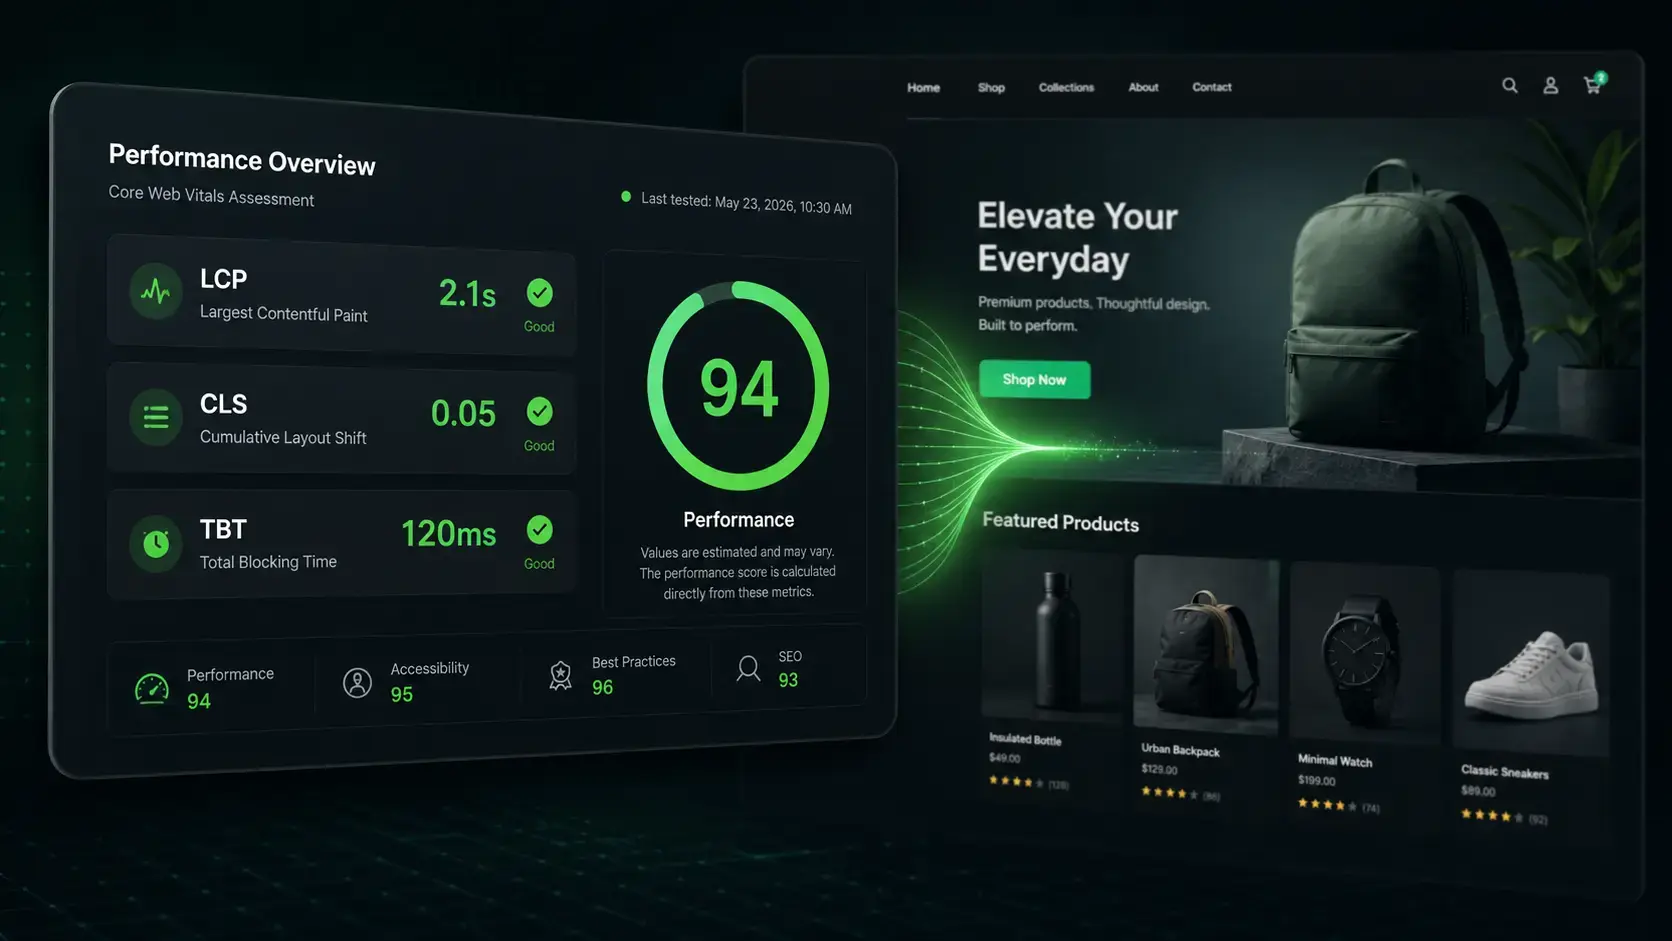
Always profile before you optimize — Lighthouse and WebPageTest tell you exactly what's slow; guessing wastes time on the wrong fixes.
Images and third-party apps cause the vast majority of Shopify performance problems — fix those two categories first, every time.
Move non-critical JavaScript out of and defer or lazy-load anything that isn't needed for the first paint.
Section-level performance budgets (limiting what each section is allowed to load) prevent regressions as a theme grows over time.
The Shopify Online Store Speed Report and Lighthouse don't always agree — know which one your actual audience experiences.
Performance work is never "done" — it needs to be part of the review process for every new section, not a one-time cleanup.
1. Profile First, Optimize Second
The single biggest time-waster in performance work is optimizing based on assumption instead of data. Developers often jump straight to compressing images or minifying CSS because those feel like the obvious culprits — and sometimes they're not even close to the real bottleneck.
- Lighthouse (Chrome DevTools or PageSpeed Insights) — run it in incognito mode, mobile throttling on, on the actual product/collection page templates (not just the homepage — Shopify stores are judged page-by-page).
- WebPageTest — for a real network waterfall. This is where render-blocking scripts and slow third-party requests become visible in a way Lighthouse's summary score doesn't fully expose.
- Shopify's own Online Store Speed report — found under Online Store → Themes → Speed. This uses Shopify's real merchant traffic data via Boomerang/RUM, which can diverge meaningfully from a synthetic Lighthouse run, especially for stores with significant international traffic on slower connections.
2. Fix Images the Right Way — Not Just "Compress Them"
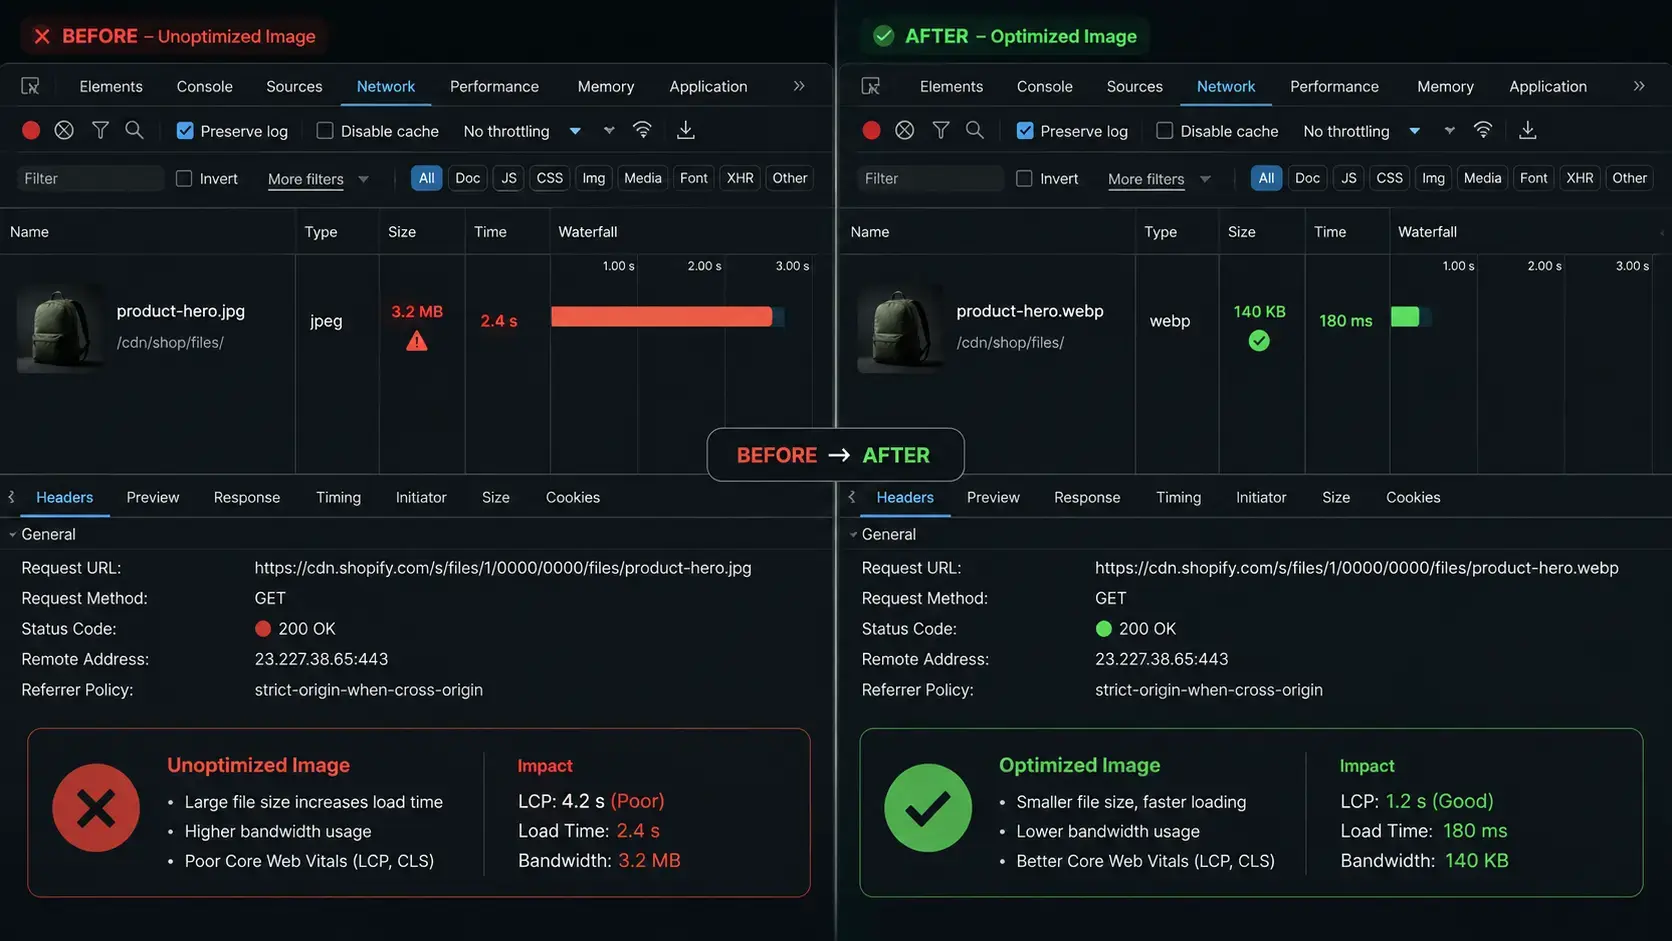
Image weight is still the most common cause of a slow Largest Contentful Paint on Shopify storefronts, but the fix isn't just running images through a compressor. The real fix is serving the correct size for the actual device, with the browser choosing the right variant automatically. Shopify's CDN already supports on-the-fly resizing through the image_url filter — most themes just don't use it correctly.
{% assign img = product.featured_media.preview_image %}

<img
  src="{{ img | image_url: width: 800 }}"
  srcset="
    {{ img | image_url: width: 400 }} 400w,
    {{ img | image_url: width: 800 }} 800w,
    {{ img | image_url: width: 1200 }} 1200w,
    {{ img | image_url: width: 1600 }} 1600w
  "
  sizes="(min-width: 990px) 50vw, 100vw"
  width="{{ img.width }}"
  height="{{ img.height }}"
  loading="{% if forloop.first %}eager{% else %}lazy{% endif %}"
  fetchpriority="{% if forloop.first %}high{% else %}auto{% endif %}"
  alt="{{ img.alt | escape }}"
>- width and height attributes — without these, the browser can't reserve layout space before the image loads, which is the leading cause of Cumulative Layout Shift on product pages.
- fetchpriority="high" on the hero/first image — this tells the browser to fetch it before other non-critical resources, directly improving Largest Contentful Paint. Every image after the first should stay loading="lazy" and fetchpriority="low".
- sizes matching your actual CSS layout — a mismatched sizes attribute causes the browser to download a larger variant than it needs, silently undoing the whole point of srcset.
3. Audit and Ration Third-Party Apps
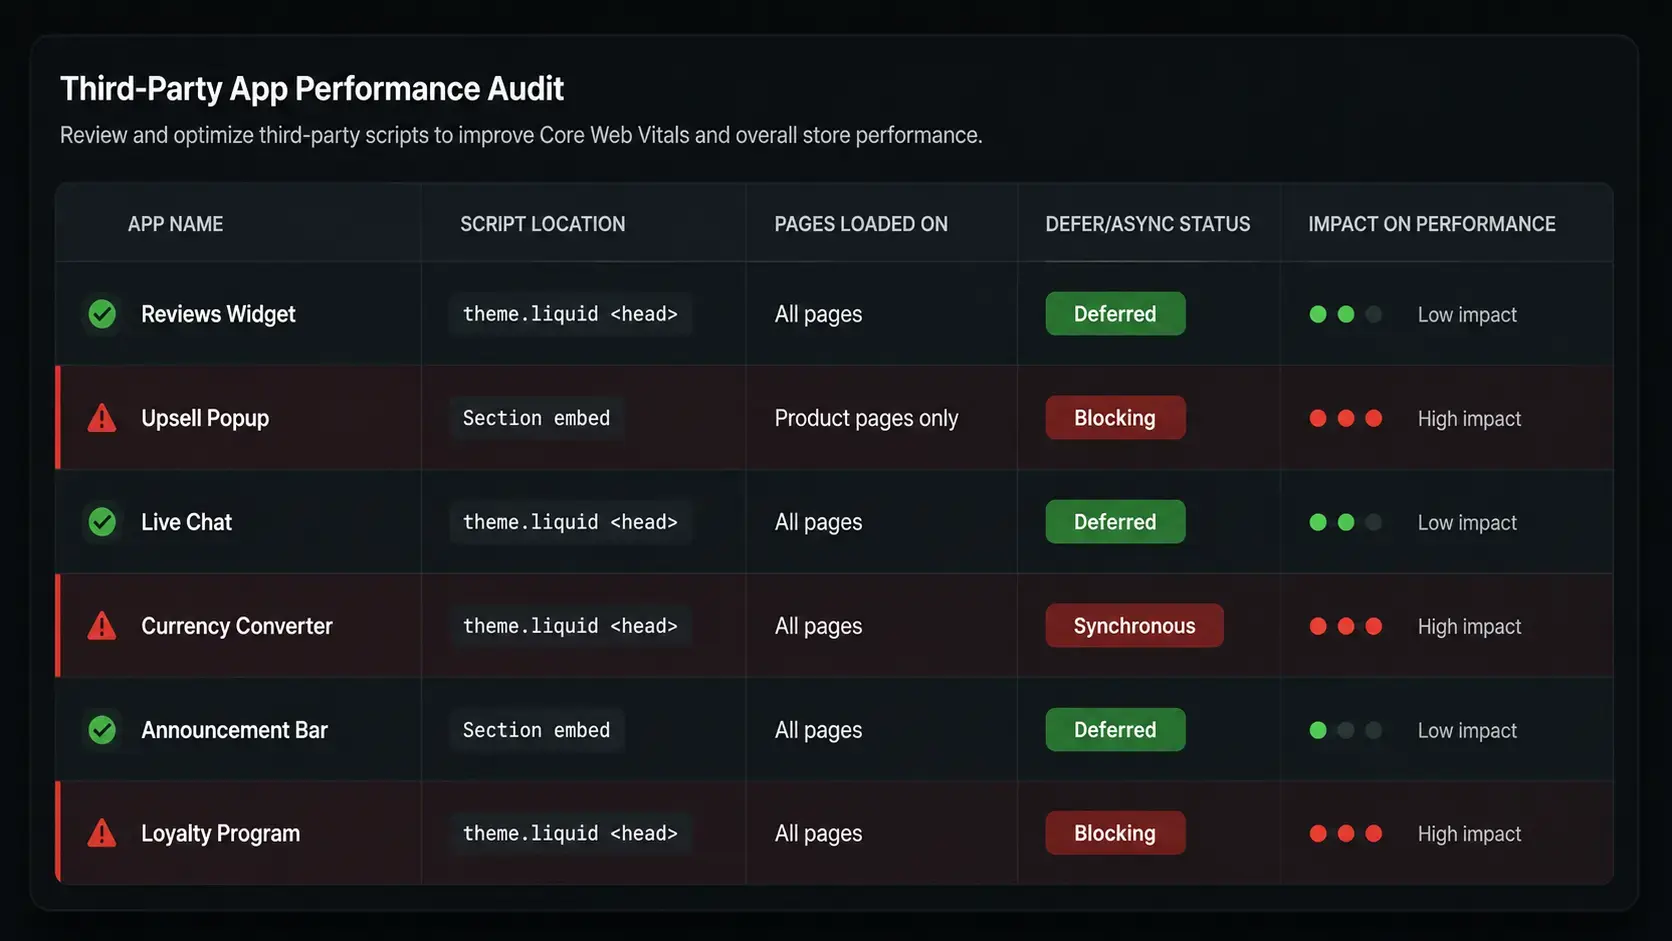
Apps are the most underestimated performance cost in Shopify theme projects, because the app's own listing rarely mentions what it does to page speed — and by the time it's installed, "just add one more app" feels harmless every single time.
- Does it inject a <script> tag synchronously in <head>? That blocks the entire page from rendering until it downloads and executes.
- Does it load its own copy of jQuery or another library the theme already has? Duplicate library loads are shockingly common and easy to miss.
- Does it make a network request on every page, even pages where its feature isn't visible (e.g., a reviews widget's script loading on the homepage)?
- Is there a theme app embed or section-based alternative that only loads on the pages where it's actually used?
<script src="https://cdn.reviews-app.com/widget.js"></script>
<script src="https://cdn.upsell-app.com/widget.js"></script>
<script src="https://cdn.chat-app.com/widget.js"></script>
<!-- layout/theme.liquid — after -->
{% if template contains 'product' %}
  <script src="https://cdn.reviews-app.com/widget.js" defer></script>
{% endif %}
{% if template contains 'cart' %}
  <script src="https://cdn.upsell-app.com/widget.js" defer></script>
{% endif %}
<script src="https://cdn.chat-app.com/widget.js" defer></script>
The defer attribute alone — letting the script download in parallel but execute only after the HTML is parsed — recovers a meaningful chunk of Total Blocking Time on almost every theme we've audited. Scoping which templates load a script at all recovers even more, and it's a five-minute fix once you know which apps are guilty.
A practical rule for client work: every app that touches theme.liquid gets logged in a simple audit — what it loads, on which pages, and whether it's deferred. Revisit that list quarterly; apps get added over a store's life far more often than they get removed.
4. Stop Shipping CSS the Page Doesn't Use
A single global stylesheet is convenient to write and expensive to ship. If theme.css contains styles for the blog, the FAQ accordion, and six sections the store no longer uses, every visitor downloads and parses all of it — on every page, including the checkout redirect and the 404 page.
<style>
  {{ 'critical.css' | asset_url | inline_asset_content }}
</style>
<link rel="preload" href="{{ 'theme.css' | asset_url }}" as="style" onload="this.onload=null;this.rel='stylesheet'">
<noscript><link rel="stylesheet" href="{{ 'theme.css' | asset_url }}"></noscript>
This renders the visible portion of the page immediately using a small, hand-maintained critical stylesheet, while the full theme stylesheet loads without blocking the initial paint.
{% stylesheet %}
.hero { padding-block: 4rem; }
.hero__heading { font-size: clamp(2rem, 5vw, 3.5rem); }
{% endstylesheet %}
This is more setup discipline than a one-line fix, but it's the difference between a 180KB stylesheet loading on every page and a product page only loading the ~15KB of CSS its actual sections need.
5. Stop Re-Computing the Same Liquid Data
This one doesn't show up in Lighthouse the same obvious way image and script problems do, but it shows up directly in Total Blocking Time and server response time — Liquid rendering happens server-side, and redundant loops add up on pages with a lot of sections.
{% assign related = collection.products | where: "tags", "featured" %}
<!-- sections/upsell-banner.liquid, further down the same page -->
{% assign related = collection.products | where: "tags", "featured" %}
<!-- sections/footer-recommendations.liquid -->
{% assign related = collection.products | where: "tags", "featured" %}
The same filter runs three separate times on the same page because three different developers (or the same developer, six months apart) each wrote their own section without checking what already existed. On a collection with a few hundred products, that's not free.
<!-- sections/related-products.liquid -->
{% render 'featured-products' %}
{% for product in featured_products %}
  ...
{% endfor %}
It's a small change, but on theme audits with a dozen+ sections per page, this kind of redundant computation is a surprisingly common contributor to slow Time to First Byte — especially on high-traffic collection pages.
6. Set a Performance Budget Per Section
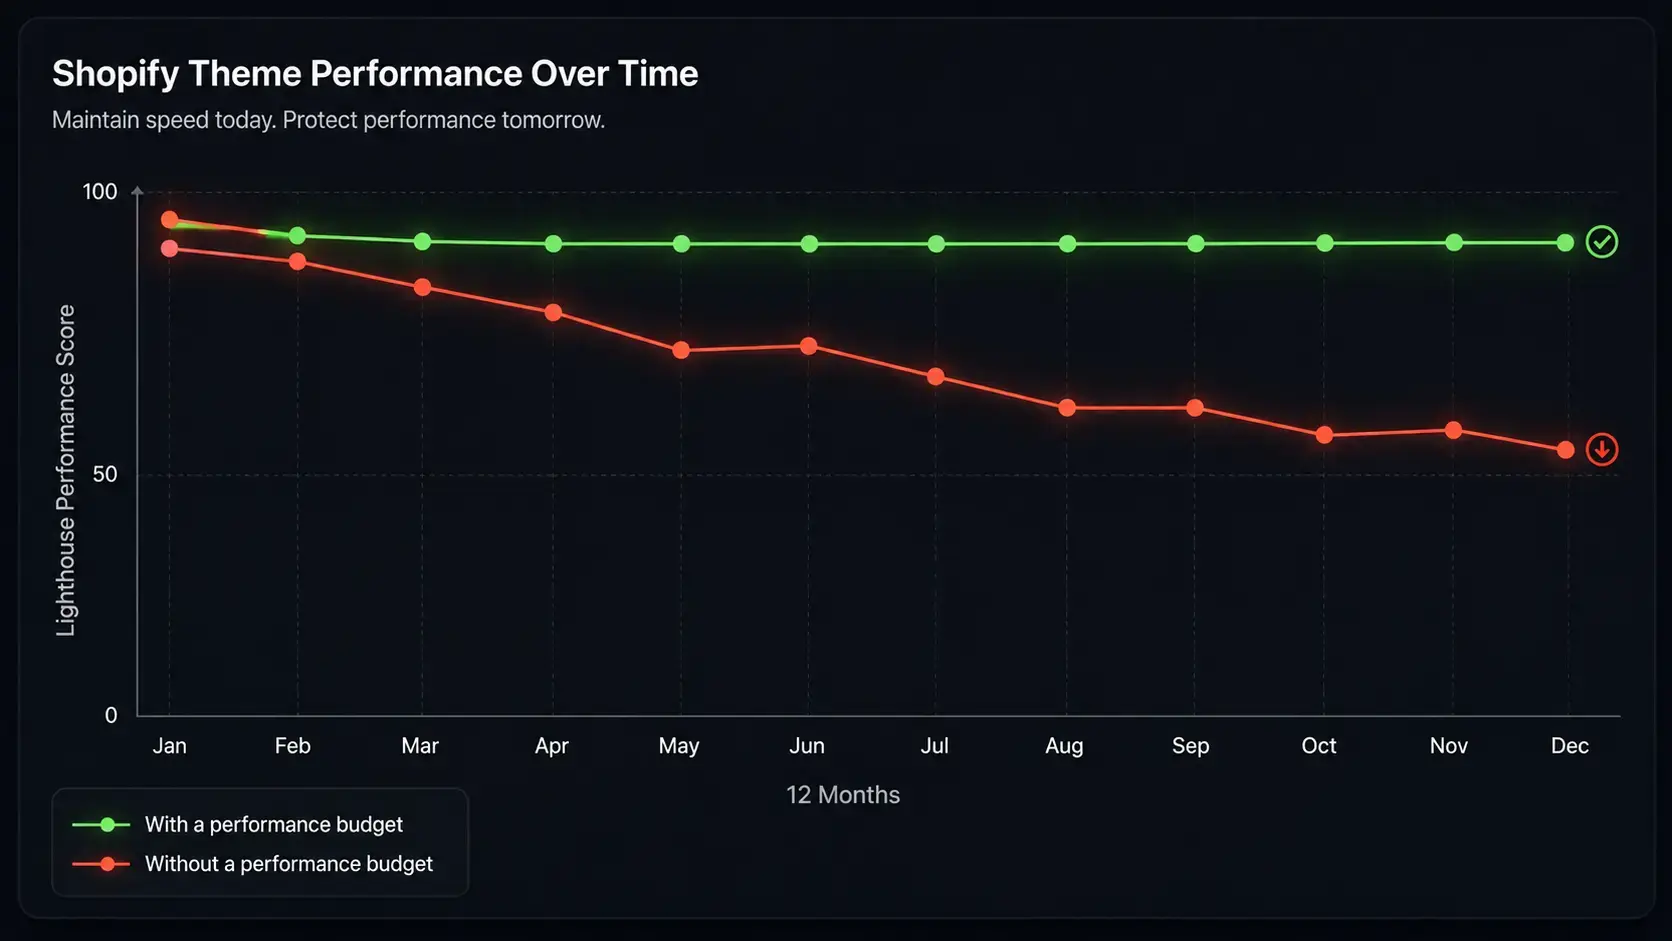
Every fix above solves an existing problem. This one prevents new ones. Without an explicit rule, a theme that scores 95 on launch day quietly degrades to 60 over the next year — not from one bad decision, but from twenty small ones, each individually reasonable ("just one more app embed," "just one more hero image variant").
This is a five-minute addition to a pull request template or a client handoff document, and it's the difference between a theme that stays fast and one that needs this exact audit again in eighteen months.
Part 2 of an 8-part series on building production-grade Shopify themes
In the first post of this series, we covered the mistakes that quietly turn a custom Shopify theme into a slow, hard-to-maintain liability — and performance topped that list for good reason. It’s the one mistake merchants actually feel: slow pages lose mobile conversions, hurt SEO ranking, and drag down the Online Store Speed score inside the Shopify admin.
This post is the workflow we actually run on real client themes — not a checklist of generic “optimize your images” advice, but the specific order of operations, the tools we profile with, and the exact Liquid and asset-loading patterns that move the needle. If you follow this in order, you’ll fix the highest-impact issues first instead of guessing.
tools & technologies
Tools used for this approach
conclusion
The takeaway
Performance work on a Shopify theme isn't a single afternoon of image compression — it's an ordered workflow: profile with real tools, fix images and app bloat first because they're the highest-impact culprits, stop shipping unused CSS and redundant Liquid computation, and then protect the result with a performance budget so the next six months of section additions don't quietly undo the work. Run through this list once on your current theme and you'll likely find at least two or three of these issues already live in production — they're common precisely because they're easy to miss during normal feature development, not because they're hard to understand once you know where to look. The next post in this series goes deep on Shopify's sections and blocks system itself — how to design a block architecture that's genuinely flexible for merchants without turning into an unmaintainable settings-schema sprawl.